I was just granted access to the new Google Webmaster Tools Search Impact report, which is going to be available in Google Webmaster Tools. The Search Impact report is currently in Alpha (not even in Beta yet), but it offers a lot more insight into what’s going on with your website. If you’ve been granted access it should show up at the URL above. It will eventually show up for everyone who has a Google Webmaster Tools account, and you’ll be able to analyze more search data about your site. Here is a sneak peak of what the Search Impact report looks like and what you’ll be able to do and see with this report.
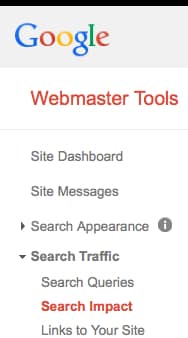
According to Google, you can use the Search Impact report to breakdown your clicks and position metrics by one of six dimensions: date, popular queries, top pages, leading countries, user device and Google Search property. You can also compare and filter across these dimensions. The Search Impact report is different than the Search Queries report, and will eventually show up in Google Webmaster Tools under the Search Traffic tab, like this:
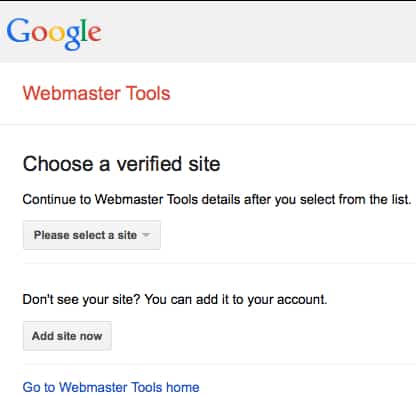
First, when you go to access the Google Webmaster Tools search impact report, you have to choose a verified site:
I chose my site, BillHartzer.com. The report then displays like this:
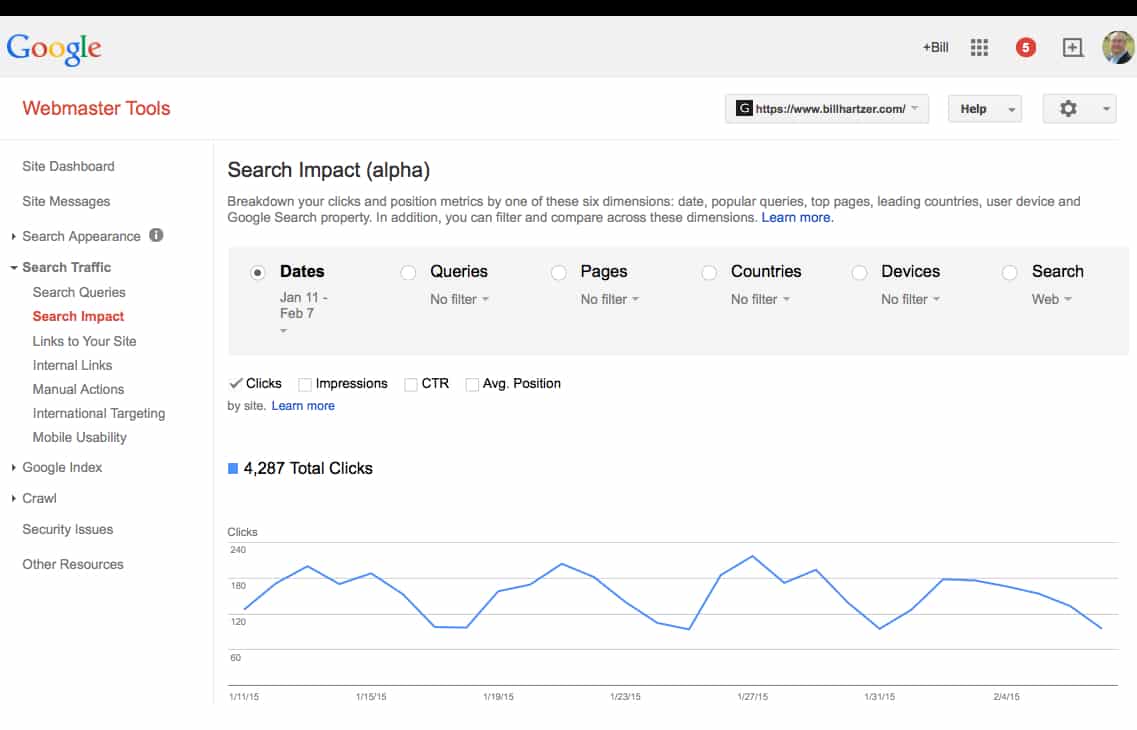
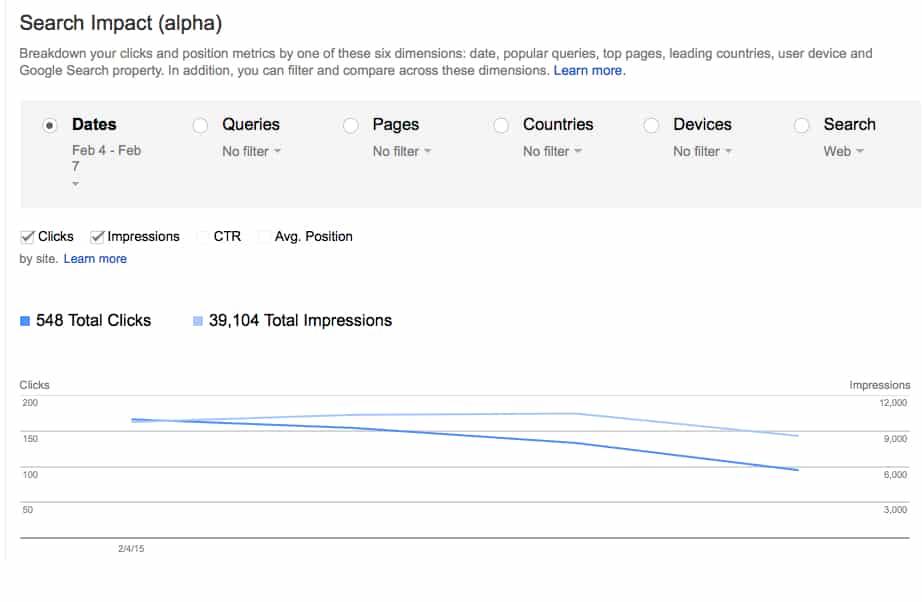
I then clicked on the “clicks” and “impressions” checkboxes, with the Jan 11 – Feb 7 Dates selected. What’s interesting to me is that the graph shows that the clicks and impressions are fairly close to one another, but at the end (around Feb 5 or 6), these lines actually cross one another. This is something that I want to investigate further.
I used the drop-down below the date and changed the date to narrow the time (I chose a custom date range).
The only issue I have with this is that the drop-down arrow is so small, initially it was tough for me realize at first that you needed to click it. But that’s not a really big issue here to be concerned about.
I changed the table to show the Pages (I don’t want to show you my search queries right now, so I’m not showing that). But here’s the Pages view:

Note that on the Pages view you don’t have a graph that shows up even though you select the Clicks and Impressions checkboxes. There is only a list of the URLs, and that makes sense to me–how would you show the URLs in a graph? I suppose you could show the same chart as the Dates graph, but for now Google shows the URLs in a list.
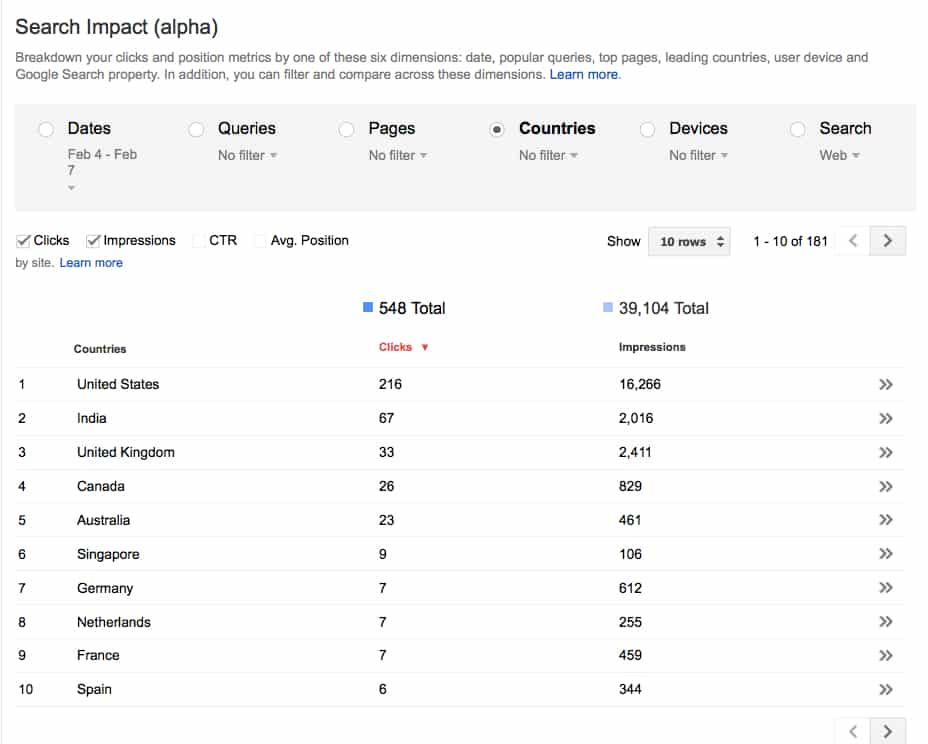
The Countries radio button shows the top countries, and that’s expected for me. I am based in the USA, so it makes sense to me that I would have more clicks from the United States. But I’m surprised that India is double what the United Kingdom and Canada is. Don’t people do SEO in the UK and Canada?
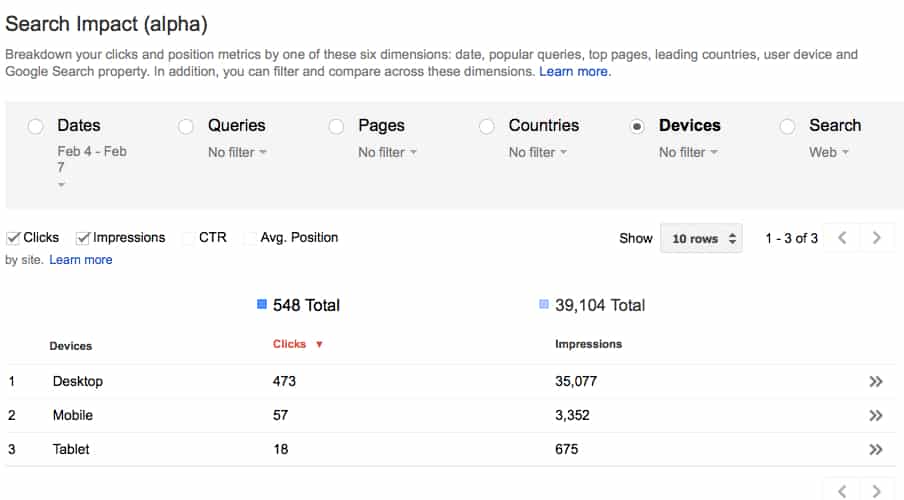
The Devices radio button reveals the Desktop / Mobile / Tablet data. Interesting to see that Desktop users account for more visitors to my site by far. I thought that Mobile would be higher, and it’s interesting to note that Mobile is separated from Tablet. I would have thought that Tablets would be used more to view my site, because it’s mostly reading material, but I’m wrong about that.
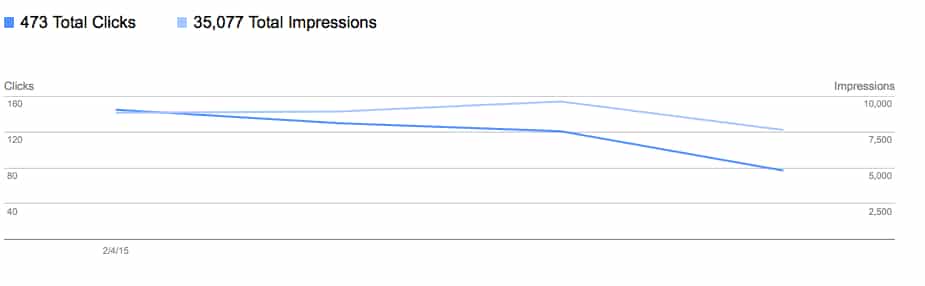
By the way, there is a “double arrow” symbol next to each line on the right side (see the screen cap above). If you click that you will be taken to a graph of the data, as shown below. This is the data for Desktop:
We can see another radio button called “Search” and when you click it you get this:

Well, apparently this really is in alpha, because there is an error that it’s not currently supported.
For now, that’s really all that I can see as far as functionality goes with the Google Webmaster Tools Search Impact report. At this point, it’s still in Alpha, but it is interesting to see the data and start to dig in a little bit further into data that apparently is the “not provided” data that you don’t get when using Google Analytics. I currently don’t see any way to export any of this data, which would be really great, I suppose that you could probably scrape the data and put into a spreadsheet that you could cross-reference with Google Analytics data, or use some sort of database to do that.
I’d like to see, though, some way to export the data and would like to see how it integrates with Google Analytics to see more of my own data and search queries, average positions, clicks, and CTR. After all, it’s my data, isn’t it?
There is some discussion here on Google Plus about this new report. Also, Barry did a review of it as well.