I analyzed the past 6 months of Googlebot’s crawling activity on my website, specifically looking to see how often AMP pages, versus blog posts, versus pages are being crawled by Google on my site. What I found was pretty interesting.
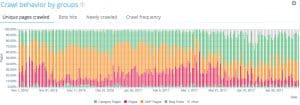
With the help of Oncrawl, I was about to analyze the log files on my site and specifically pull out Googlebot’s crawling activity. During the past 6 months, prior to around March 9, 2017, Googlebot’s crawl, on average, was made up of about 50 percent AMP pages. In other words, about 50 percent of the time they crawled pages on my site that are in the AMP format. I have installed the AMP WordPress plugin on my site, and those URLs all end in /amp/ on my site. So, if you go to a blog post on my site, and add /amp/ to the end of the URL, you’ll see the AMP version of the same page.
After around March 9, 2017, though, there was a big drop in Googlebot’s crawling of AMP pages. It dropped to about 30 percent, whereas they started to favor crawling blog posts much more than AMP pages of those blog posts. Prior to March 9, 2017, Googlebot crawled the blog posts about 30 percent of the time, and other URLs about 20 percent of the time:
AMP Pages – 50 percent
Blog Posts – 30 percent
Pages & other URLs – 20 percent
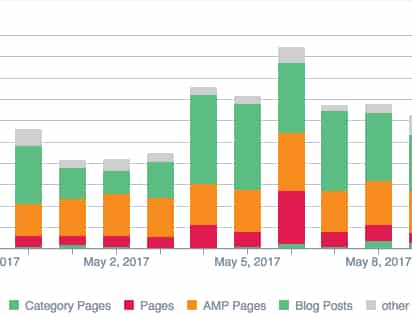
Also with the help of OnCrawl, I analyzed the past month’s worth of log files on my website. I wanted to fully understand Googlebot’s crawling activity, which pages are crawled, what type of pages are crawled, and how often Googlebot crawls those pages. After looking at a month’s worth of data (April 24, 2017 to May 23, 2017), I discovered that Googlebot crawls, on average, AMP pages about 28 percent of the time, as compared to blog post pages, which they crawl about 44 percent of the time.
Googlebot crawled blog posts on my site, on average, 44 percent of the time. AMP pages are crawled, on average, 29 percent of the time. Googlebot crawled other URLs, such as pages, category pages, and other URLs on the site 27 percent of the time.
To put it another way, here’s the makeup of bot crawling activity over the last 30 day period, on average:
Blog Posts – 44.48 percent
AMP Pages – 28.82 percent
Pages – 12.2 percent
Other URLs and Category pages – 14.5 percent
What’s interesting to me is this overall shift, since March 9th, 2017, in the change of crawling of AMP pages. I know that according to Marie Haynes, the Google Fred update, a major quality update, came out March 7-8, 2017. This was a quality update that apparently rewards sites for a good EAT (Experience, Authority and Trust).
Prior to the Google Fred update, I’m not seeing any changes in crawling activity related to Google’s crawling of AMP pages versus regular blog posts or pages. From January through March, though, I saw a rather large increase of crawling around pages on the site (static pages) versus blog posts. For example, during that time, Googlebot kicked up their crawling activity on static pages, and didn’t crawl blog posts as often as they did in the past. At the end of March 2017, though, the crawling activity of static pages went down.
In comparison, looking at Google organic traffic since the Google Fred update, traffic from Google organic search is up 42 percent. So, with the drop of Google crawling AMP pages (down to only 30 percent of pages crawled), that’s good for me, as I don’t really see much traffic at all from Google AMP. I have Google Analytics installed on my AMP pages, and you can pretty much say that the traffic is non-existent to AMP pages.
The Google Fred algorithm update definitely had an effect on AMP pages, as they’re crawling them much less than they did before. It went down from 50 percent to around 30 percent currently (in the past month). As far as I can tell, visitors tend to like to go to actual blog posts much more than AMP pages.
This is the crawling activity on my own personal site, this website. I recommend that you look at your own site’s log files and analyze them in order to see how often Google is crawling your own site.

