Semrush released a second study of ChatGPT topic behavior on August 3, and it answers the question the first one left hanging. The July research told us that domain-level SEO metrics do a poor job of predicting who owns a topic. This one identifies what does a better job, and the answer has an uncomfortable edge to it.
The headline finding for anyone planning a content calendar: a brand that appeared in only one of a category’s five prompts was associated with a drop in mention share. Not a modest gain. A drop. That penalty stayed in place until the brand reached at least three of the five prompts.
Partial coverage of a category looks worse than staying out of it.
The full Semrush study on how topical authority spreads in ChatGPT is worth reading alongside my write-up of the earlier topic ownership research, because the two fit together.
What The New Study Measured
Margarita Loktionova and Kevin Indig of Growth Memo worked from the same tracking base as before. The same 1,094 US categories, five prompt variants each, monitored monthly from January through June 2026. This round produced 283,215 domain-category citation observations and 76,493 brand-mention observations, plus 45,578 category-expansion appearances mapped to 1,458 brand entities.
Two definitions carry the analysis. A brand’s core expertise was any category where it had already shown up in at least three of the five prompts before the month being measured. Category closeness was scored by semantic similarity between the target category’s prompts and the categories the brand already answered well.
That second definition is the part most write-ups will skip past, and it is the mechanism behind everything that follows.
Citations Travel. Brand Names Stay Home.
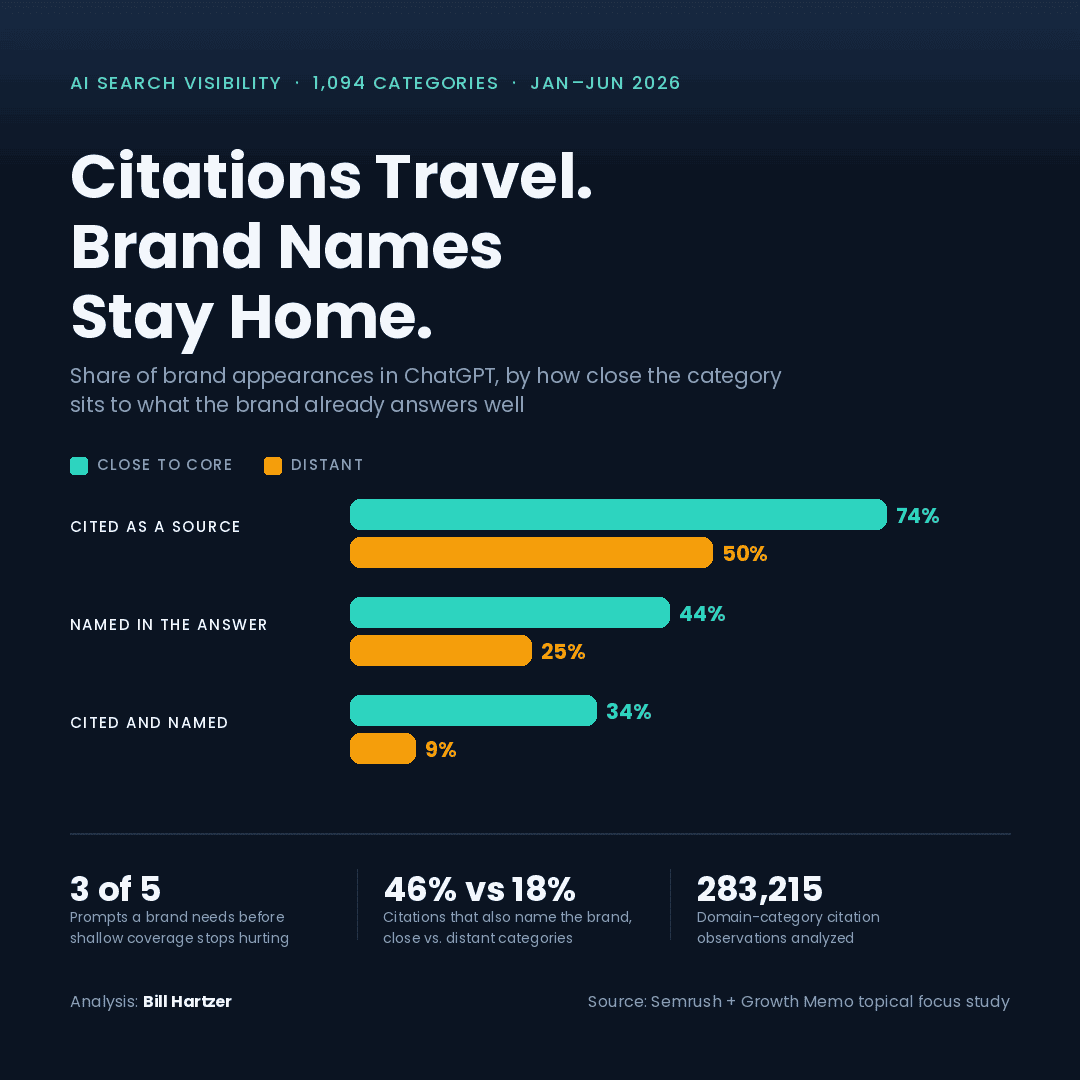
In categories close to a brand’s core expertise, brands were cited as a source in 74% of appearances, named in the answer text in 44%, and both cited and named in 34%.
Move out to categories distant from that core and the numbers collapse to 50% cited, 25% named, and 9% both.
The conversion rate tells the same story more sharply. Among citations in the least related categories, 18% also carried a named brand. In the most relevant categories, 46% did. Roughly two and a half times the rate, and the both-cited-and-mentioned gap of 34% against 9% is close to a fourfold spread.
Indig put the practical version plainly:
Being cited in many categories does not show a spread-thin effect in this sample. But brand recognition works differently. The categories where a brand consistently earns named mentions are the ones from which it can credibly expand.
Why The Two Signals Behave So Differently
Here is my read on the mechanism, and it is the piece I have not seen anyone else state.
Citations and mentions come out of two different systems. A citation is a retrieval outcome. A document matched the query, cleared the source bar for relevance, authority and freshness, and got linked. Retrieval scores documents. It has no opinion about whether your company belongs in a category. Publish a competent article about a subject you have no business in and retrieval will happily surface it.
A mention is a generation outcome. The model names a brand because its internal representation associates that entity with that domain of expertise. Entities, not pages.
That distinction explains the whole distance curve. Documents port across categories because document scoring is local to the document. Entity associations do not port, because they were built from everything the model has absorbed about who you are. It also explains the finding from the July study that only 21% of most-cited domains were also the most-mentioned brand, with a slightly negative correlation of -0.229. That number always read as strange to me. This study shows it was an average taken across a distribution with real structure inside it. Close to your core, the two signals converge. Far from it, they come apart.
Legal And Healthcare Break The Pattern
Industry changed the shape of the results. In finance and real estate, broader category coverage came with more citation leverage. Legal and healthcare behaved differently. Citation gains from wider coverage were weaker, and even at full five-prompt coverage, mention share still trended negative.
Anyone who has worked on medical or legal sites through the last decade of Google quality updates will recognize that fingerprint. These are the categories where search engines have applied a raised bar for years, and the model appears to carry a similar reluctance to name a brand in high-stakes regulated subjects no matter how thoroughly that brand covers the questions.
I want to flag that as inference rather than finding. The study did not test author credentials, licensure signals or primary research, and the authors said so. If you sell into legal or healthcare, coverage depth reads as table stakes in this data, not as the lever. The lever is probably credentialing and third-party validation, and somebody should test that properly.
The Question I Would Ask Before Acting On Any Of This
Every relationship in this study is observational. No controls, no intervention, and the authors chose the phrase “associated with” carefully.
So here is the question that keeps me from taking the depth finding at face value. Is shallow coverage causing the drop in mention share, or is shallow coverage a symptom of being a small brand? A company that appears in one of five prompts in a category is plausibly a company nobody has heard of. It would show a weak mention share whether or not it published anything else. Reverse causality is very much alive in that chart, and the one-of-five penalty may be measuring brand size wearing a coverage costume.
The 1,458 mapped brand entities are worth noting too. The July study drew on more than 50,000 brands. The expansion analysis here rests on a much narrower base, and narrow bases produce confident-looking curves.
None of that makes the work less valuable. It makes it a set of hypotheses good enough to plan against and not yet good enough to bet the quarter on.
What This Changes About Category Planning
The old playbook was to publish one piece into a new category, watch what happens, and decide whether to commit. This data says that test costs you something and teaches you very little, because a single appearance sits below the threshold where the signal turns positive.
Treat three of five prompts as your minimum viable entry. Below that, you are buying a result the study associates with going backward.
Pick your next category by proximity rather than by traffic estimate. Semantic similarity to what you already answer well is the variable that moved the numbers here, and you can approximate it yourself. Embed your existing prompt sets, embed the candidate category’s prompts, rank the candidates by cosine similarity, and work outward from the top. That is a Tuesday afternoon of Python, not a platform purchase.
Then feed the mention side of the equation, because that is the side that gates expansion. Clear positioning, consistent entity signals, and coverage from the sources the model actually reads: review platforms, industry publications, communities, expert commentary.
Topical authority buys you a running start into the category next door. It does not buy you a category three doors down, and the data says the attempt may cost you ground in the process.